


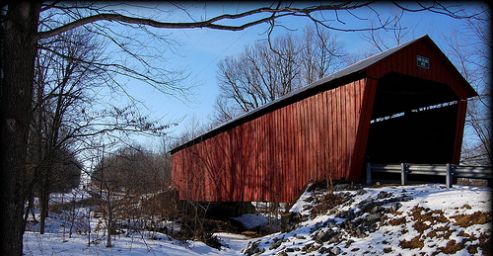


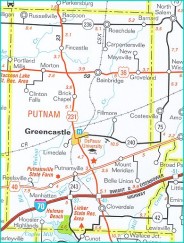
Putnam County Demographics
The following demographic data tables are supplied by the Indiana Business Research Center from various government sources.
IBRC – Putnam County, IN – Population Over Time
| Population Over Time | |||||
| 1990 | 1998 | 2003 | 2008 | 2013 | |
| Total Population | 30,315 | 34,551 | 36,698 | 37,186 | 37,505 |
| Change Since 1990 | 4,236 | 6,383 | 6,871 | 7,190 | |
| Pct. Change Since 1990 | 14.0% | 21.1% | 22.7% | 23.7% | |
Source: US Census Bureau
IBRC – Putnam County, IN – Population Projections
| Population Projections | |||||
| 2010 | 2015 | 2020 | 2025 | 2030 | |
| Population Projections | 37,963 | 38,494 | 38,897 | 39,220 | 39,391 |
| Change Since 2010 | 531 | 934 | 1,257 | 1,428 | |
| Pct. Change Since 2010 | 1.4% | 2.5% | 3.3% | 3.8% | |
Source: Indiana Business Research Center.
Note: 2010 data are census counts from the U.S. Census Bureau
Note: 2010 data are census counts from the U.S. Census Bureau
IBRC – Putnam County, IN – Components of Population Change
| Components of Population Change 2012 to 2013 | ||
| Number | ||
| Net Domestic Migration | -175 | |
| International Migration | 2 | |
| Natural Increase (births minus deaths) | 45 | |
| Births | 350 | |
| Deaths | 305 | |
Source: US Census Bureau
IBRC – Putnam County, IN – Population Estimates by Age
| Population Estimates by Age in 2012 | ||
| Number | Pct. Dist | |
| Preschool (0 to 4) | 1,888 | 5.0% |
| School Age (5 to 17) | 5,875 | 15.6% |
| College Age (18 to 24) | 5,230 | 13.9% |
| Young Adult (25 to 44) | 9,146 | 24.3% |
| Older Adult (45 to 64) | 10,151 | 27.0% |
| Older (65 plus) | 5,460 | 14.5% |
Source: US Census Bureau
IBRC – Putnam County, IN – Population Estimates by Race and Hispanic Origin
| Population Estimates by Race and Hispanic Origin in 2012 | ||
| Number | Pct. Dist | |
| American Ind. or Alaskan Native Alone | 120 | 0.3% |
| Asian Alone | 288 | 0.8% |
| Black Alone | 1,524 | 4.0% |
| Native Hawaiian and Other Pac. Isl. Alone | 17 | 0.0% |
| White Alone | 35,402 | 94.0% |
| Two or More Race Groups | 399 | 1.1% |
| Hispanic or Latino | ||
| Non-Hispanic or Latino | 37,118 | 98.6% |
| Hispanic or Latino | 632 | 1.7% |
Source: US Census Bureau
IBRC – Putnam County, IN – Per Capita Income Over Time
| Per Capita Income Over Time | |||||
| 1992 | 1997 | 2002 | 2007 | 2012 | |
| Total Per Capita Income | $15,708 | $19,763 | $23,790 | $29,136 | $33,289 |
| Change Since 1991 | $4,055 | $8,082 | $13,428 | $17,581 | |
| Pct. Change Since 1991 | 25.8% | 51.5% | 85.5% | 111.9% | |
Source: Bureau of Economic Analysis
IBRC – Putnam County, IN – Households
| Households in 2012 | ||
| Number | Pct. Dist | |
| Total Households | 12,493 | 100.0% |
| Family Households | 8,955 | 71.7% |
| Married with Children | 2,708 | 21.7% |
| Married without Children | 4,614 | 36.9% |
| Single Parents | 903 | 7.2% |
| Other | 730 | 5.8% |
| Non-family Households | 3,538 | 28.3% |
| Living Alone | 2,819 | 22.6% |
| Average Household Size | 3.01 | |
| Average Family Household Size | 4.20 | |
Source: US Census Bureau, American Community Survey 5 Year Estimates
IBRC – Putnam County, IN – Housing Unit Estimates
| Housing Unit Estimates | ||
| Number | ||
| 14,706 | ||
| Chg. since 2000 | 1,201 | |
| %Chg. since 2000 | 8.9% | |
Source: US Census Bureau
IBRC – Putnam County, IN – Housing Units
| Housing Units in 2012 | |
| Number | |
| Total Housing Units | 14,697 |
| Occupied | 12,493 |
| Owner Occupied | 9,876 |
| Renter Occupied | 2,617 |
| Vacant | 2,204 |
| Average Household Size | 3.01 |
| Average Family Household Size | 4.20 |
Source:U.S. Census Bureau & American Community Survey 5 Year Estimates