Labor Shed Demographics
The following demographic data tables are supplied by the Indiana Business Research Center (IBRC) from various government sources. The Putnam County labor shed consists of Putnam and the surrounding six counties of Clay, Hendricks, Montgomery, Morgan, Owen, and Parke Counties.
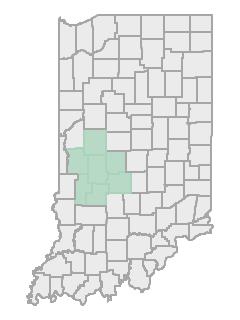
IBRC – Putnam County Labor Shed – Population Over Time
| Population Over Time | |||||
| 1990 | 1998 | 2003 | 2008 | 2013 | |
| Total Population | 253,784 | 296,116 | 327,678 | 350,026 | 364,549 |
| Change Since 1990 | 42,332 | 73,894 | 96,242 | 110,765 | |
| Pct. Change Since 1990 | 16.7% | 29.1% | 37.9% | 43.6% | |
Source: US Census Bureau
IBRC – Putnam County Labor Shed – Population Projections
| Population Projections | |||||
| 2010 | 2015 | 2020 | 2025 | 2030 | |
| Population Projections | 356,233 | 377,916 | 397,756 | 416,092 | 431,995 |
| Change Since 2010 | 21,683 | 41,523 | 59,859 | 75,762 | |
| Pct. Change Since 2010 | 6.1% | 11.7% | 16.8% | 21.3% | |
Source: Indiana Business Research Center.
Note: 2010 data are census counts from the U.S. Census Bureau
Note: 2010 data are census counts from the U.S. Census Bureau
IBRC – Putnam County Labor Shed – Components of Population Change
| Components of Population Change 2012 to 2013 | ||
| Number | ||
| Net Domestic Migration | 1,359 | |
| International Migration | 347 | |
| Natural Increase (births minus deaths) | 1,308 | |
| Births | 4,161 | |
| Deaths | 2,853 | |
Source: US Census Bureau
IBRC – Putnam County Labor Shed – Population Estimates by Age
| Population Estimates by Age in 2012 | ||
| Number | Pct. Dist | |
| Preschool (0 to 4) | 21,793 | 6.0% |
| School Age (5 to 17) | 66,309 | 18.3% |
| College Age (18 to 24) | 31,172 | 8.6% |
| Young Adult (25 to 44) | 91,763 | 25.4% |
| Older Adult (45 to 64) | 100,904 | 27.9% |
| Older (65 plus) | 49,139 | 13.6% |
Source: US Census Bureau
IBRC – Putnam County Labor Shed – Population Estimates by Race and Hispanic Origin
| Population Estimates by Race and Hispanic Origin in 2012 | ||
| Number | Pct. Dist | |
| American Ind. or Alaskan Native Alone | 1,127 | 0.3% |
| Asian Alone | 4,483 | 1.2% |
| Black Alone | 11,169 | 3.1% |
| Native Hawaiian and Other Pac. Isl. Alone | 148 | 0.0% |
| White Alone | 339,823 | 94.0% |
| Two or More Race Groups | 4,330 | 1.2% |
| Hispanic or Latino | ||
| Non-Hispanic or Latino | 352,156 | 97.4% |
| Hispanic or Latino | 8,924 | 2.5% |
Source: US Census Bureau
IBRC – Putnam County Labor Shed – Per Capita Income Over Time
| Per Capita Income Over Time | |||||
| 1992 | 1997 | 2002 | 2007 | 2012 | |
| Total Per Capita Income | $18,169 | $22,534 | $27,472 | $32,631 | $36,850 |
| Change Since 1991 | $4,365 | $9,303 | $14,462 | $18,681 | |
| Pct. Change Since 1991 | 24.0% | 51.2% | 79.6% | 102.8% | |
Source: Bureau of Economic Analysis
IBRC – Putnam County Labor Shed – Households
| Households in 2012 | ||
| Number | Pct. Dist | |
| Total Households | 129,752 | 100.0% |
| Family Households | 95,969 | 74.0% |
| Married with Children | 32,495 | 25.0% |
| Married without Children | 45,712 | 35.2% |
| Single Parents | 10,749 | 8.3% |
| Other | 7,013 | 5.4% |
| Non-family Households | 33,783 | 26.0% |
| Living Alone | 28,550 | 22.0% |
| Average Household Size | 2.79 | |
| Average Family Household Size | 3.77 | |
Source: US Census Bureau, American Community Survey 5 Year Estimates
IBRC – Putnam County Labor Shed – Housing Unit Estimates
| Housing Unit Estimates | ||
| Number | ||
| 288,812 | ||
| Chg. since 2000 | 166,003 | |
| %Chg. since 2000 | 135.2% | |
Source: US Census Bureau
IBRC – Putnam County Labor Shed – Housing Units
| Housing Units in 2012 | |
| Number | |
| Total Housing Units | 144,560 |
| Occupied | 129,752 |
| Owner Occupied | 103,082 |
| Renter Occupied | 26,670 |
| Vacant | 14,808 |
| Average Household Size | 2.79 |
| Average Family Household Size | 3.77 |
Source: U.S. Census Bureau & American Community Survey 5 Year Estimates
Updated: 06/2014

