


Workforce – Availability
Labor Shed
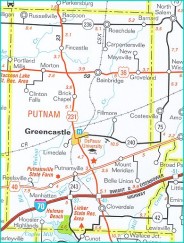
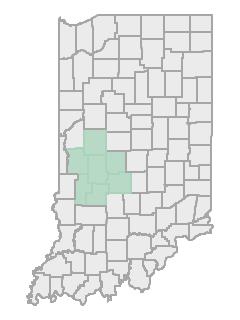
The seven county labor shed includes Putnam and the surrounding six counties of Clay, Hendricks, Morgan, Montgomery, Owen and Parke. These counties make up the primary labor shed that supplies workers to businesses in Putnam County.
High School Graduates
| Putnam County | Class of 2007 | 394 |
| Class of 2008 | 424 | |
| Class of 2009 | 401 | |
| Class of 2010 | 417 | |
| Class of 2011 | 420 | |
| Class of 2012 | 384 | |
| Class of 2013 (Estimate) | 510 | |
| Class of 2014 (Estimate) | 473 | |
| Class of 2015 (Estimate) | 483 | |
| Class of 2016 (Estimate) | 479 | |
| Class of 2017 (Estimate) | 481 | |
| Seven County Labor Shed | Class of 2007 | 3,579 |
| Class of 2008 | 3,805 | |
| Class of 2009 | 3,882 | |
| Class of 2010 | 3,973 | |
| Class of 2011 | 4,025 | |
| Class of 2012 | 3,925 | |
| Class of 2013 (Estimate) | 4,511 | |
| Class of 2014 (Estimate) | 4,609 | |
| Class of 2015 (Estimate) | 4,685 | |
| Class of 2016 (Estimate) | 4,787 | |
| Class of 2017 (Estimate) | 4,829 |
Labor Force – As defined by the US Bureau of Labor Statistics
| Putnam County | 2005 Annual | 17,770 |
| 2006 Annual | 17,714 | |
| 2007 Annual | 17,591 | |
| 2008 Annual | 17,763 | |
| 2009 Annual | 17,167 | |
| 2010 Annual | 17,471 | |
| 2011 Annual | 17,600 | |
| 2012 Annual | ||
| 2013 Annual | 17,240 | |
| Seven County Labor Shed | 2004 Annual | 173,961 |
| 2005 Annual | 177,234 | |
| 2006 Annual | 179,565 | |
| 2007 Annual | 178,834 | |
| 2008 Annual | 181,311 | |
| 2009 Annual | 178,267 | |
| 2010 Annual | 178,142 | |
| 2011 Annual | 178,737 | |
| 2012 Annual | 177,462 | |
| 2013 Annual | 179,041 | |
| Labor Force Growth – 1990 – 1999 | ||
| Putnam County | 22.4% | |
| Seven County Labor Shed | 23.1% | |
| State of Indiana | 10.8% | |
| Labor Force Growth – 2000-2009 | ||
| Putnam County | 1.8% | |
| Seven County Labor Shed | 9.0% | |
| State of Indiana | 2.7% |
Unemployment
| Putnam County | 2005 Annual | 6.5% |
| 2006 Annual | 5.3% | |
| 2007 Annual | 5.3% | |
| 2008 Annual | 6.7% | |
| 2009 Annual | 11.0% | |
| 2010 Annual | 10.8% | |
| 2011 Annual | 10.3% | |
| 2012 Annual | 9.0% | |
| 2013 Annual | 7.7% | |
| Seven County Labor Shed | 2005 Annual | 5.0% |
| 2006 Annual | 4.3% | |
| 2007 Annual | 4.1% | |
| 2008 Annual | 5.3% | |
| 2009 Annual | 9.1% | |
| 2010 Annual | 9.3% | |
| 2011 Annual | 8.6% | |
| 2012 Annual | 7.9% | |
| 2013 Annual | 6.9% |
Persons Seeking Employment
| West Central Indiana | Typical Month |
10-16,000 |
Persons Commuting Out of County for Employment
| Estimate from 2005 State Tax Returns | 6,436 | |
| Estimate from 2006 State Tax Returns | 6,376 | |
| Estimate from 2007 State Tax Returns | 5,541 | |
| Estimate from 2008 State Tax Returns | 5,960 | |
| Estimate from 2009 State Tax Returns | 5,408 | |
| Estimate from 2010 State Tax Returns | 5,439 | |
| Estimate from 2011 State Tax Returns | 5,406 | |
| Estimate from 2012 State Tax Returns | 5,434 |
Persons Entering The Workforce
| Population Aged 20-24 | ||
| Putnam County | 2010 Census | 3,426 |
| Seven County Labor Shed | 2010 Census | 19,992 |
| Population Aged 20-24 | ||
| Putnam County | 2015 Projection | 3,461 |
| 2020 Projection | 3.503 | |
| Seven County Labor Shed | 2015 Projection | 21,883 |
| 2020 Projection | 22,689 | |
| Population Growth (Census) | 1990-2000 | 2000-2010 |
| Putnam County | 18.8% | 5.4% |
| Seven County Labor Shed | 22.2% | 14.9% |
| State of Indiana | 9.7% | 6.6% |
Note: The seven county labor shed includes Putnam and the surrounding six counties of Clay, Hendricks, Morgan, Montgomery, Owen and Parke. These counties make up the primary labor shed that supplies workers to businesses in Putnam County.
Source – STATS Indiana and Bureau of Labor Statistics
Updated: 06/2014